Examining Memory, Stacks,Registers using the GNU Debugger
Examing Memory,stack and registers in a simple C program using GDB
In this post we look at how a reverse engineer can begin reverse engineering by examining the memory, stack and registers of a running process.
The code is a very simple program to add two integers passed as command line arguments and prints a string with the result
#include <stdio.h>
#include <stdlib.h>

int add(int x, int y){
    int z=10;
    z=x+y;
    return z;
}
main(int argc,char **argv){
    int a=atoi(argv[1]);
    int b=atoi(argv[2]);
    int c;
    char buffer[100];
    gets(buffer);
    puts(buffer);
    c=add(a,b);
    printf("Sum of %d+%d = %d ",a,b,c);
    exit(0);
}
Compile using the command below and call the executable with some arguments..
$ gcc -ggdb -o memory_demo memory_demo.c
$ ./memory_demo 32 23
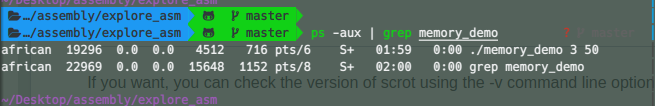
In another separate window lets obtain the process id( pid ) of the program with
$ ps -aux | grep memory_demo
The result should be similar to :
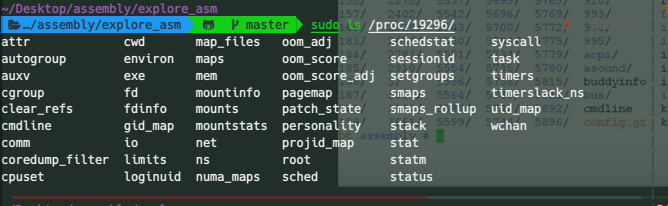
In the linux filesystem the /proc/ contains the runtime information associated with all running processes and thus you should find a directory in this directory with a name corresponding to the process id you obtained above.
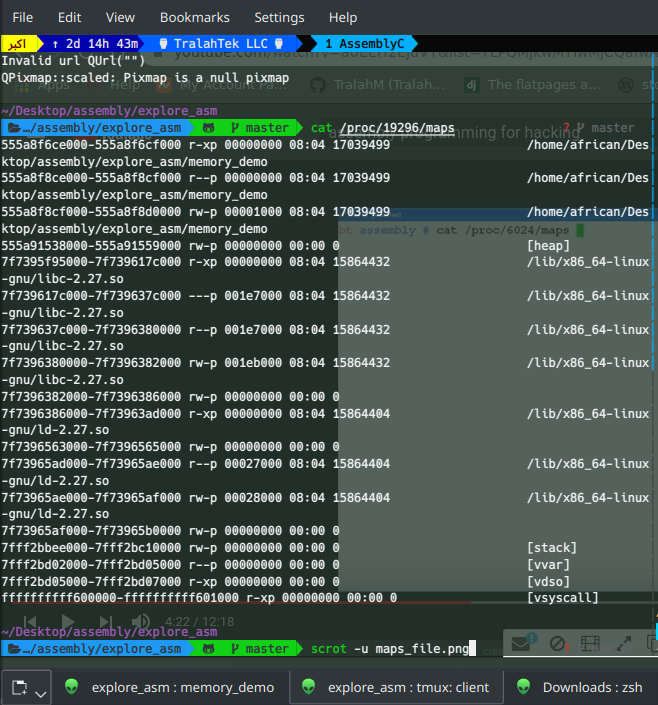
Our interest is the maps file which contains the memory layout in virtual memory
$ cat /proc/YOUR_PID/maps